The Lab
December 29, 2025

Bullish or Bearish Right Now?

Type any ticker. Our Sentiment Cheat Sheet instantly analyzes 14 technical indicators across four timeframes and shows the bullish vs bearish score in one glance.

Before you enter any trade you want to know one thing: is the technical setup bullish or bearish?

The honest answer takes work. You'd need to pull up moving averages on three timeframes, check whether RSI is above or below 50, see whether the MACD line is above or below its signal line and zero, look at where price sits relative to the previous day and previous week's high/low, and decide whether the 20/50 and 50/200 moving averages are in a golden or death cross. Then you'd weigh all of that against each other. Most traders skip the work and lean on one or two indicators.

We built the shortcut.

The Sentiment Cheat Sheet

Sentiment Cheat Sheet showing the bullish vs bearish indicator tally and per-indicator breakdown across four timeframes

Type a ticker. The tool pulls 20 years of daily bars, runs 14 technical indicators against the latest close, and gives you two numbers: how many are bullish, how many are bearish. SPY at 11 bullish to 3 bearish reads very differently than SPY at 6 to 8, and the breakdown tells you whether the bulls are concentrated in the short term or the long term, which is the part that matters for what you're about to do.

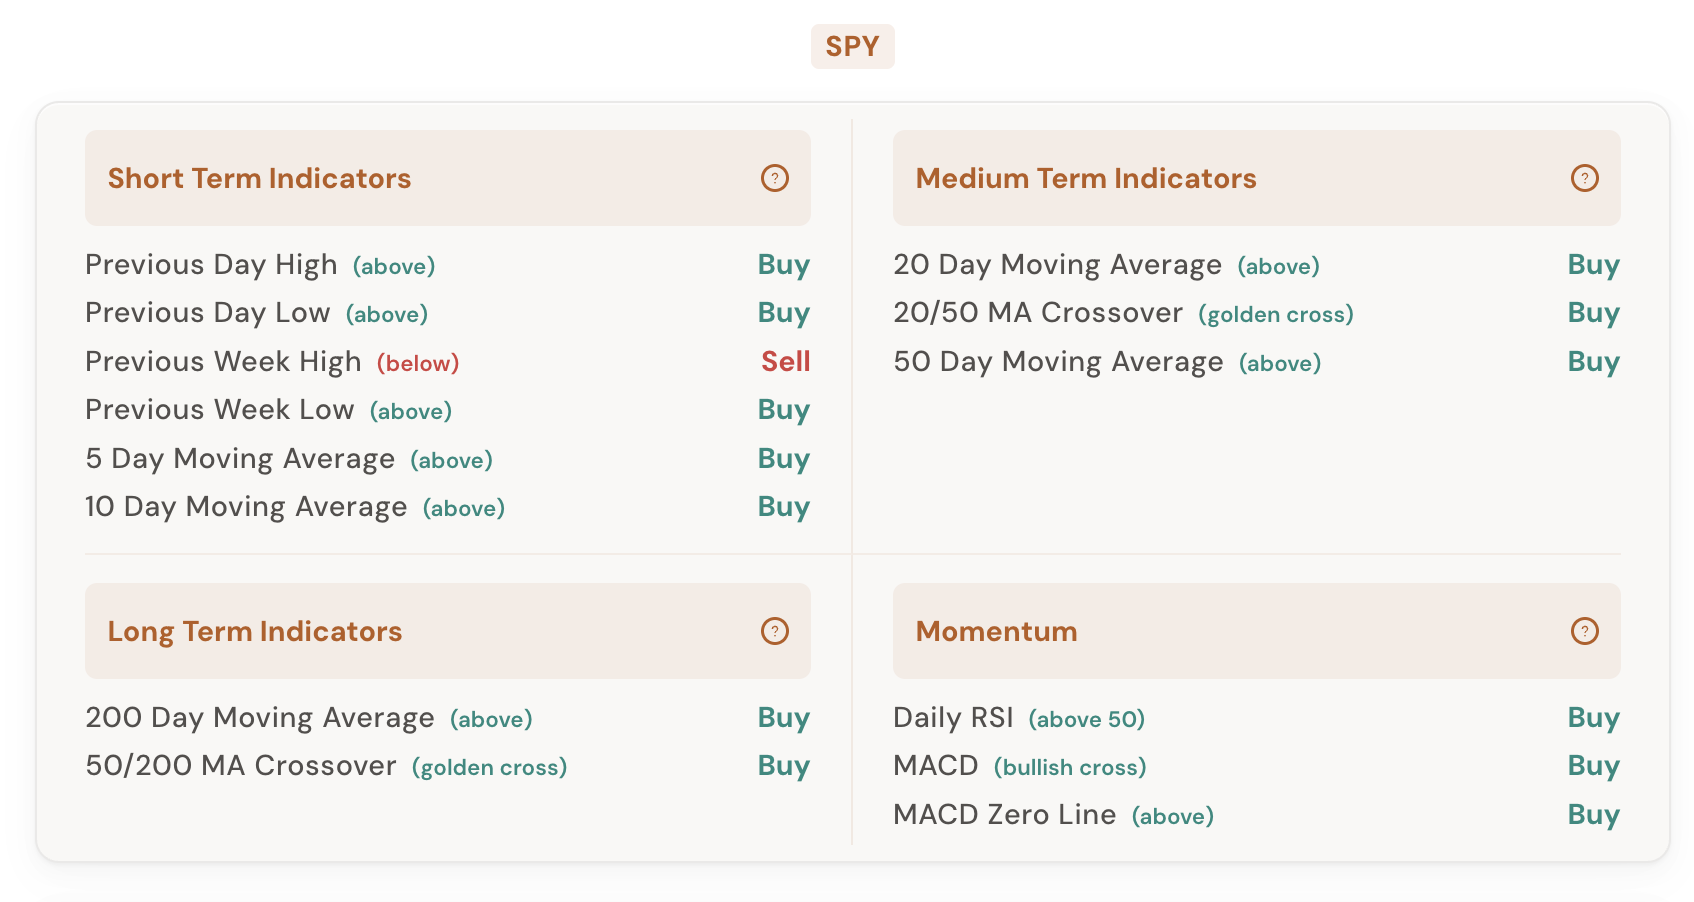
Below the tally, the same 14 indicators are grouped into four cards by timeframe (Short Term, Medium Term, Long Term, and Momentum). Each row tells you the exact reading (price above the 50-day MA, RSI above 50, MACD bullish cross, 20/50 golden cross, etc.) and tags it Buy or Sell. Below the cards, an Indicators Log lists every constituent in a flat table with category, raw reading, and signal, so you can audit exactly why the count came out the way it did.

No verdict labels, no "Strong Buy" gauge, no black-box composite. The count is the read, and the constituent indicators are right there to be checked.

What the Tool Shows You

14 indicators, four timeframes, every reading sourced and click-expandable.

Tally

Bullish vs Bearish Count

The Parameters sidebar shows the running count: how many of the 14 indicators are flagged Buy and how many are flagged Sell. The split IS the verdict: no aggregation, no weighting, no hidden score.

Timeframes

Short / Medium / Long / Momentum

Six short-term indicators, three medium, two long, and three momentum oscillators (RSI, MACD signal, MACD zero line), each in its own card so you can see whether the read is trend-driven or whipping with the noise.

Direction

Reading at a Glance

Every indicator labels its current state inline: (above 50), (golden cross), (bullish cross), (below). The Buy/Sell badge follows directly from that reading: no interpretation needed.

Detail

Days Since Each State Began

Every row tags how long the current state has held ("5d ago," "12d ago," "38d ago") so you can tell a fresh signal from a stale one before you act on it.

Audit

Indicators Log

Below the cards, a flat collapsible table lists every constituent indicator with its category, raw reading, and signal. Useful for verifying why the count came out the way it did.

Universal

Any Ticker

Stocks, ETFs, indices: SPY, QQQ, SPX, AAPL, UVXY, and anything else with a public ticker. The tool pulls 20 years of daily history when available and clips naturally for newer tickers.

How It Works

The tool pulls 20 years of daily bars for your ticker and runs the same 14 evaluations against today's close:

Short Term (6)

Medium Term (3)

Long Term (2)

Momentum (3)

Each row also tells you how long the current state has held: "5d ago," "12d ago," "38d ago." That date stamp is the difference between a freshly-flipped signal and one that's been in place for a quarter. They read very differently for sizing.

This is the tool you want open before any trade. One search, one screen, and you know whether the technical evidence is lined up for you, against you, or split.

How Traders Are Using It

Five ways members are already applying the Sentiment Cheat Sheet to their process.

1

Pre-trade gut check

Before sizing into a position, glance at the bullish-vs-bearish split. If you're buying SPY and the count is 4 to 10, you're trading against most of the technical evidence, and at minimum that should change your size.

2

Morning market pulse

Type SPY first thing. Twelve seconds tells you whether the indicator stack is leaning long, short, or neutral. Repeat with QQQ and IWM if you trade across them.

3

Spot the timeframe disagreement

The four cards split bullish-on-the-day from bullish-on-the-trend. A ticker that's bullish in Long Term but bearish in Short Term is in a pullback inside an uptrend, a very different setup than one bearish across all four.

4

Verify a single signal in context

If a moving-average crossover triggered on a name you watch, the cheat sheet shows you whether the rest of the indicator stack confirms the direction or contradicts it before you act.

5

Sanity-check the count

The Indicators Log at the bottom flattens all 14 readings into one table (category, raw reading, signal). Use it to confirm the bullish/bearish split is being driven by real signals across timeframes, not by one outlier dragging the count.

Try it on a ticker you own

The Sentiment Cheat Sheet is available in your dashboard under Forecasting Tools. CI Volatility members have full access; free users see a blurred preview of the same layout.

Open the Sentiment Cheat Sheet

Comments

Loading comments…